You’re on the north shore of a river, and want to cross to the south, via a series of 13 bridges and six islands, which you can see in the diagram below. But, as you approach the water, night falls, a bad storm rolls in, and you’re forced to wait until morning to try to cross. Overnight, the storm could render some of the bridges unusable — it has a 50 percent chance of knocking out each of the bridges. (The chance is independent for each bridge.)Source: FiveThirtyEight
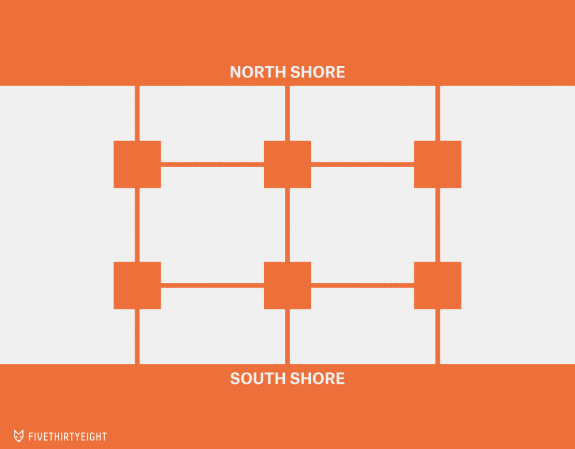
Question 1: What’s the probability you will be able to cross the river in the morning? (You have no boat, can’t swim, can’t fix the bridges, etc. No tricks.)
When tackling a problem like Ollie Roeder's latest Riddler, it's usually a useful start to break it down into a simpler problem. If the question is about a river with six islands arranged in two rows and three columns, what is the answer for a river with no islands? For one row and two columns of islands? Take a look at at these diagrams below and click to simulate 5000 runs through each scenario:
It certainly seems that regardless of how many rows and columns we've got, the answer trends towards a 50% chance you'll be able to cross the river in the morning. How can we confirm that?
Let's take the slightly easier case of a river with just two islands in it:
There are five bridges. That means that when the storm rolls through with a 50% chance of knocking out each bridge, there are 25 (32) possible combinations of bridges that survive the night.
It's also easy to see there are only four unique paths that can take you to the south shore:
If we label the paths a, b, c, d, and e as in the above animation, we can list out every possible combination of surviving bridges, as well as every available path to shore (a → d, a → c → e, b → e, b → c → d) to see the chance of success is exactly 50%:
| Working Bridges | Available Paths |
|---|---|
| a, b, c, d, e | a → d, a → c → e, b → e, b → c → d |
| a, b, c, d | a → d, b → c → d |
| a, b, c, e | a → c → e, b → e |
| a, b, d, e | a → d, b → e |
| a, c, d, e | a → d, a → c → e |
| b, c, d, e | b → e, b → c → d |
| a, b, d | a → d |
| a, c, e | a → c → e |
| a, c, d | a → d |
| a, d, e | a → d |
| a, b, e | b → e |
| b, c, d | b → c → d |
| b, d, e | b → e |
| b, c, e | b → e |
| a, d | a → d |
| b, e | b → e |
| a, b, c | None |
| c, d, e | None |
| a, b | None |
| a, c | None |
| a, e | None |
| b, c | None |
| b, d | None |
| c, e | None |
| c, d | None |
| d, e | None |
| a | None |
| b | None |
| c | None |
| d | None |
| e | None |
| None | None |
Out of 32 possible combinations of surviving bridges, 16 scenarios have at least one available path across the river.
Where do we go from here? Extrapolating that same strategy to two rows and three columns of islands gets a little trickier. There are 13 bridges, so there are 213, or 8192 combinations of bridges that may survive until morning. And there are 29 unique working paths!
Rather than list all 8192 combinations out, let's explore them. Below are the possible outcomes — click on a cell to see the outcome of that scenario displayed. Green cells have one or more safe paths available, while red cells leave you trapped on the north shore:
Ok, we feel pretty good about the first question — you've got a 50% chance of making it across the river. What about the second question?
Now imagine a different, wider river, with many more islands — in fact, arbitrarily many. Specifically, imagine that the islands are arrayed in an N-rows-by-N+1-columns grid — similar to before, where N happened to equal two — and connected by bridges to each adjacent island in the same way. Each island adjacent to the shore is also connected by a bridge to the shore. It would look something like this:
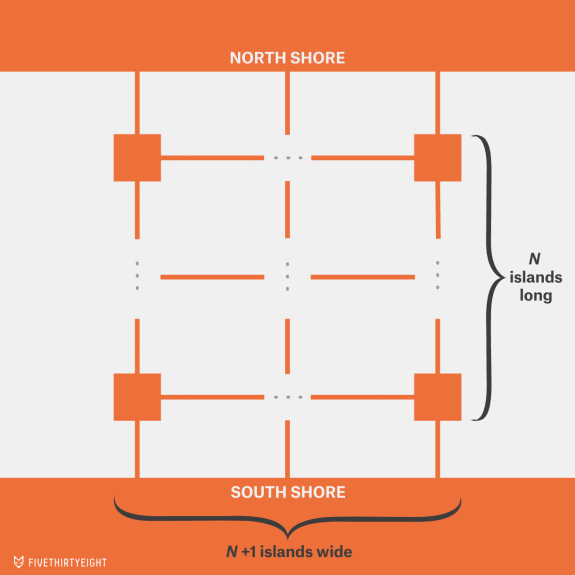
Question 2: What’s the probability you’ll be able to cross this river in the morning, after the same storm — with the same independent 50 percent chance of knocking out each bridge — rolls through?
We've already shown that for N = 0, 1 or 2 the answer is 50%. It seems likely to hold steady for larger values of N as well. Let's simulate it. Click below to run 100 trials for every value of N between 1 and 20 (warning - for higher values of N this can be slow!):
| # of rows of islands (N) | Successful crossing % |
|---|---|
| 1 | ??? |
| 2 | ??? |
| 3 | ??? |
| 4 | ??? |
| 5 | ??? |
| 6 | ??? |
| 7 | ??? |
| 8 | ??? |
| 9 | ??? |
| 10 | ??? |
| 11 | ??? |
| 12 | ??? |
| 13 | ??? |
| 14 | ??? |
| 15 | ??? |
| 16 | ??? |
| 17 | ??? |
| 18 | ??? |
| 19 | ??? |
| 20 | ??? |
Unless you had some crazy outlying results in your simulation (in which case...run it again!) you should see the answer hover around 50% for each value of N in the generalized question.
If you're like me you may be wondering, what makes this scenario special? Are the values of N rows, N + 1 columns and a 50% chance of overnight bridge failure special? Use the sandbox below to tweak the values, run the simulation again and see what happens for any combination of rows, columns, bridge safety metrics, and trials you choose.
Run trials, with rows, columns, and a bridge failure rate of %?
| # of rows | # of columns | Failure % | # of trials | Successful crossing % |
|---|---|---|---|---|
| ??? | ??? | ??? | ??? | ??? |
Try it out using N rows by N+1 columns, but with a very slightly different failure rate...you may be surprised by how much a few percent can tip the scales!
Find an interesting result? Enjoy this interactive article? Let me know @uptownnickbrown on Twitter. Thanks!